

A demand forecast your regions, zones and head office have all signed off on.
Upload about two years of sales history. Demand Planning classifies every region and product line, forecasts each one with the model that scored best on your own held-out months, and shows the accuracy beside the number. Then the forecast moves through region, zonal and national review before it splits back down to every depot.
Problems it takes off the planning team's desk
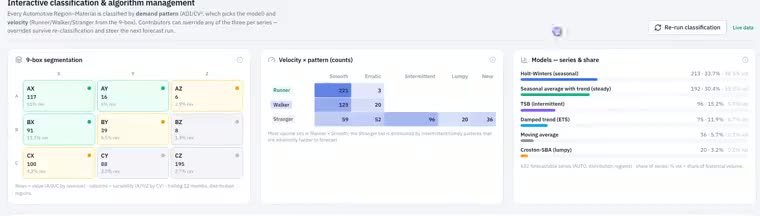
- Every region and product line is classified first: smooth, erratic, intermittent, lumpy or new
- Exponential smoothing, Croston and TSB, a zone to region roll-up and a machine-learning model all run; the one that scored best on held-out months wins, and the survivors are blended
- Accuracy, bias and a tracking signal are stored with the run and shown beside the number
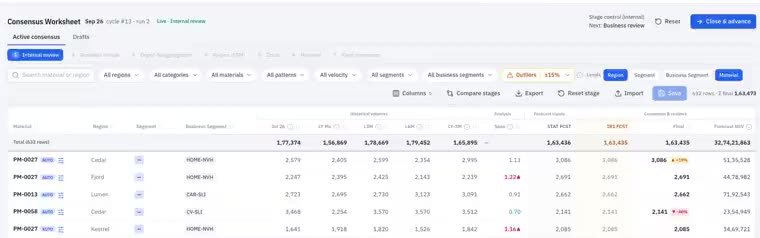
- Each stage opens a frozen snapshot with one editable column, so nobody overwrites the level below
- Region, zonal and national reviewers each work in their own scope; field reviewers see only their rows
- Publishing locks the cycle, and the whole worksheet exports to Excel and imports back
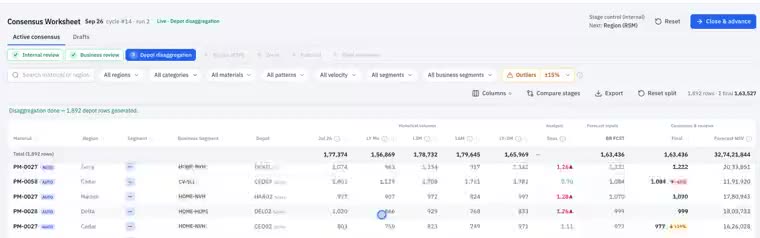
- Region to depot shares are computed from your own recent sales, never typed in
- The approved number splits down inside the same cycle, so every depot sees its own line
- Depot rows are part of the published cycle and export to Excel with it
One cycle, four steps.
Follow one planning cycle from the sales history to the depot plan. Every tile below uses demo workspace figures.

Your sales history is the setup.
No mapping project. Upload the sales history you already export, whatever the columns are called. Dates, dealers, quantities, items and plants are matched by name or by a known alias, and any row that fails a check is reported rather than dropped.
- Columns matched whatever you named them, case and spacing ignored
- Dates parsed flexibly and numbers coerced; bad rows are listed, not silently dropped
- CSV and Excel upload, or a read from your own database or SFTP drop
Two years of history and your location list.
Demand Planning is built for multi-location distributors and manufacturers with a planning team, not for a single shop. Two files get a workspace running.
- About 24 months of monthly sales history, and 36 is better, so a season can be read
- Your plant to region to zone list, so the forecast rolls up for review and splits back to depots
- Dealer to depot tagging, product groupings and a holiday list are optional and can come later
Questions people ask about Demand Planning
How much history does it need?
About 24 months of monthly sales, and 36 is better. It also needs your plant to region to zone list, so the forecast can roll up for review and split back down to depots. Under two years there is not enough to read a season.
Where is our data stored?
In India, in Azure’s Central India region. Every screen needs a login, and regional and zonal reviewers only see the rows they own.
How is the forecast made?
Every region and product line is classified by its demand pattern first. Then exponential smoothing, Croston and TSB for intermittent lines, a zone to region roll-up and a machine-learning model all run against it. Whichever scored best on held-out months is picked for that series, the survivors are blended, and the accuracy is stored with the run.
Who approves the number?
Your people. The cycle moves statistical, business, region, zonal, national, and each stage edits one column on a frozen snapshot so nobody overwrites the level below. Publishing locks the cycle, and every advance, rejection and reset is on record.
How do we start?
Send us about 24 months of sales history and your plant to region to zone list. We load it into a workspace of your own and run the first forecast with you.